Easy to use, feature-rich and inexpensive, Power BI, Microsoft's business intelligence and data visualisation tool, has become a must-have. It has beaten off the likes of Tableau and Qlik, but more importantly, it is a great replacement for Excel when it comes to visual representation of data. What are the reasons for its success?
Since its launch in 2014, Power BI has taken the lion's share of data analysis and representation tools, to the point of dethroning Excel. Yet originally, this software was simply the consolidation into a single interface of all the additions that had come to enrich the famous spreadsheet over the course of versions, such as Power Pivot for analysis and modelling, Power Query for searching databases or Power View for viewing them.
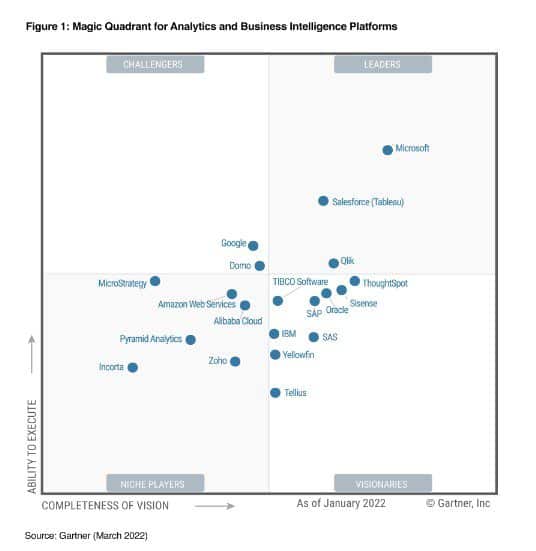
In its latest Magic Quadrant, Gartner ranks Microsoft as one of the leading vendors of business intelligence (BI) platforms, well ahead of its runner-up, Tableau, which was acquired by Salesforce in 2019.

“ Power BI is proving extremely popular, whatever the type of organisation - SME, major account, government department - or sector of activity - health, industry, energy, etc. " says Nicolas Dubois, data intelligence training consultant at BIAL-X and ORSYS trainer.
Ready-to-use tools and visuals
Power BI owes its success primarily to its ease of use. A business expert who has already designed macros in Visual Basic will find the development environment familiar from Excel, he continues. He won't be fazed."
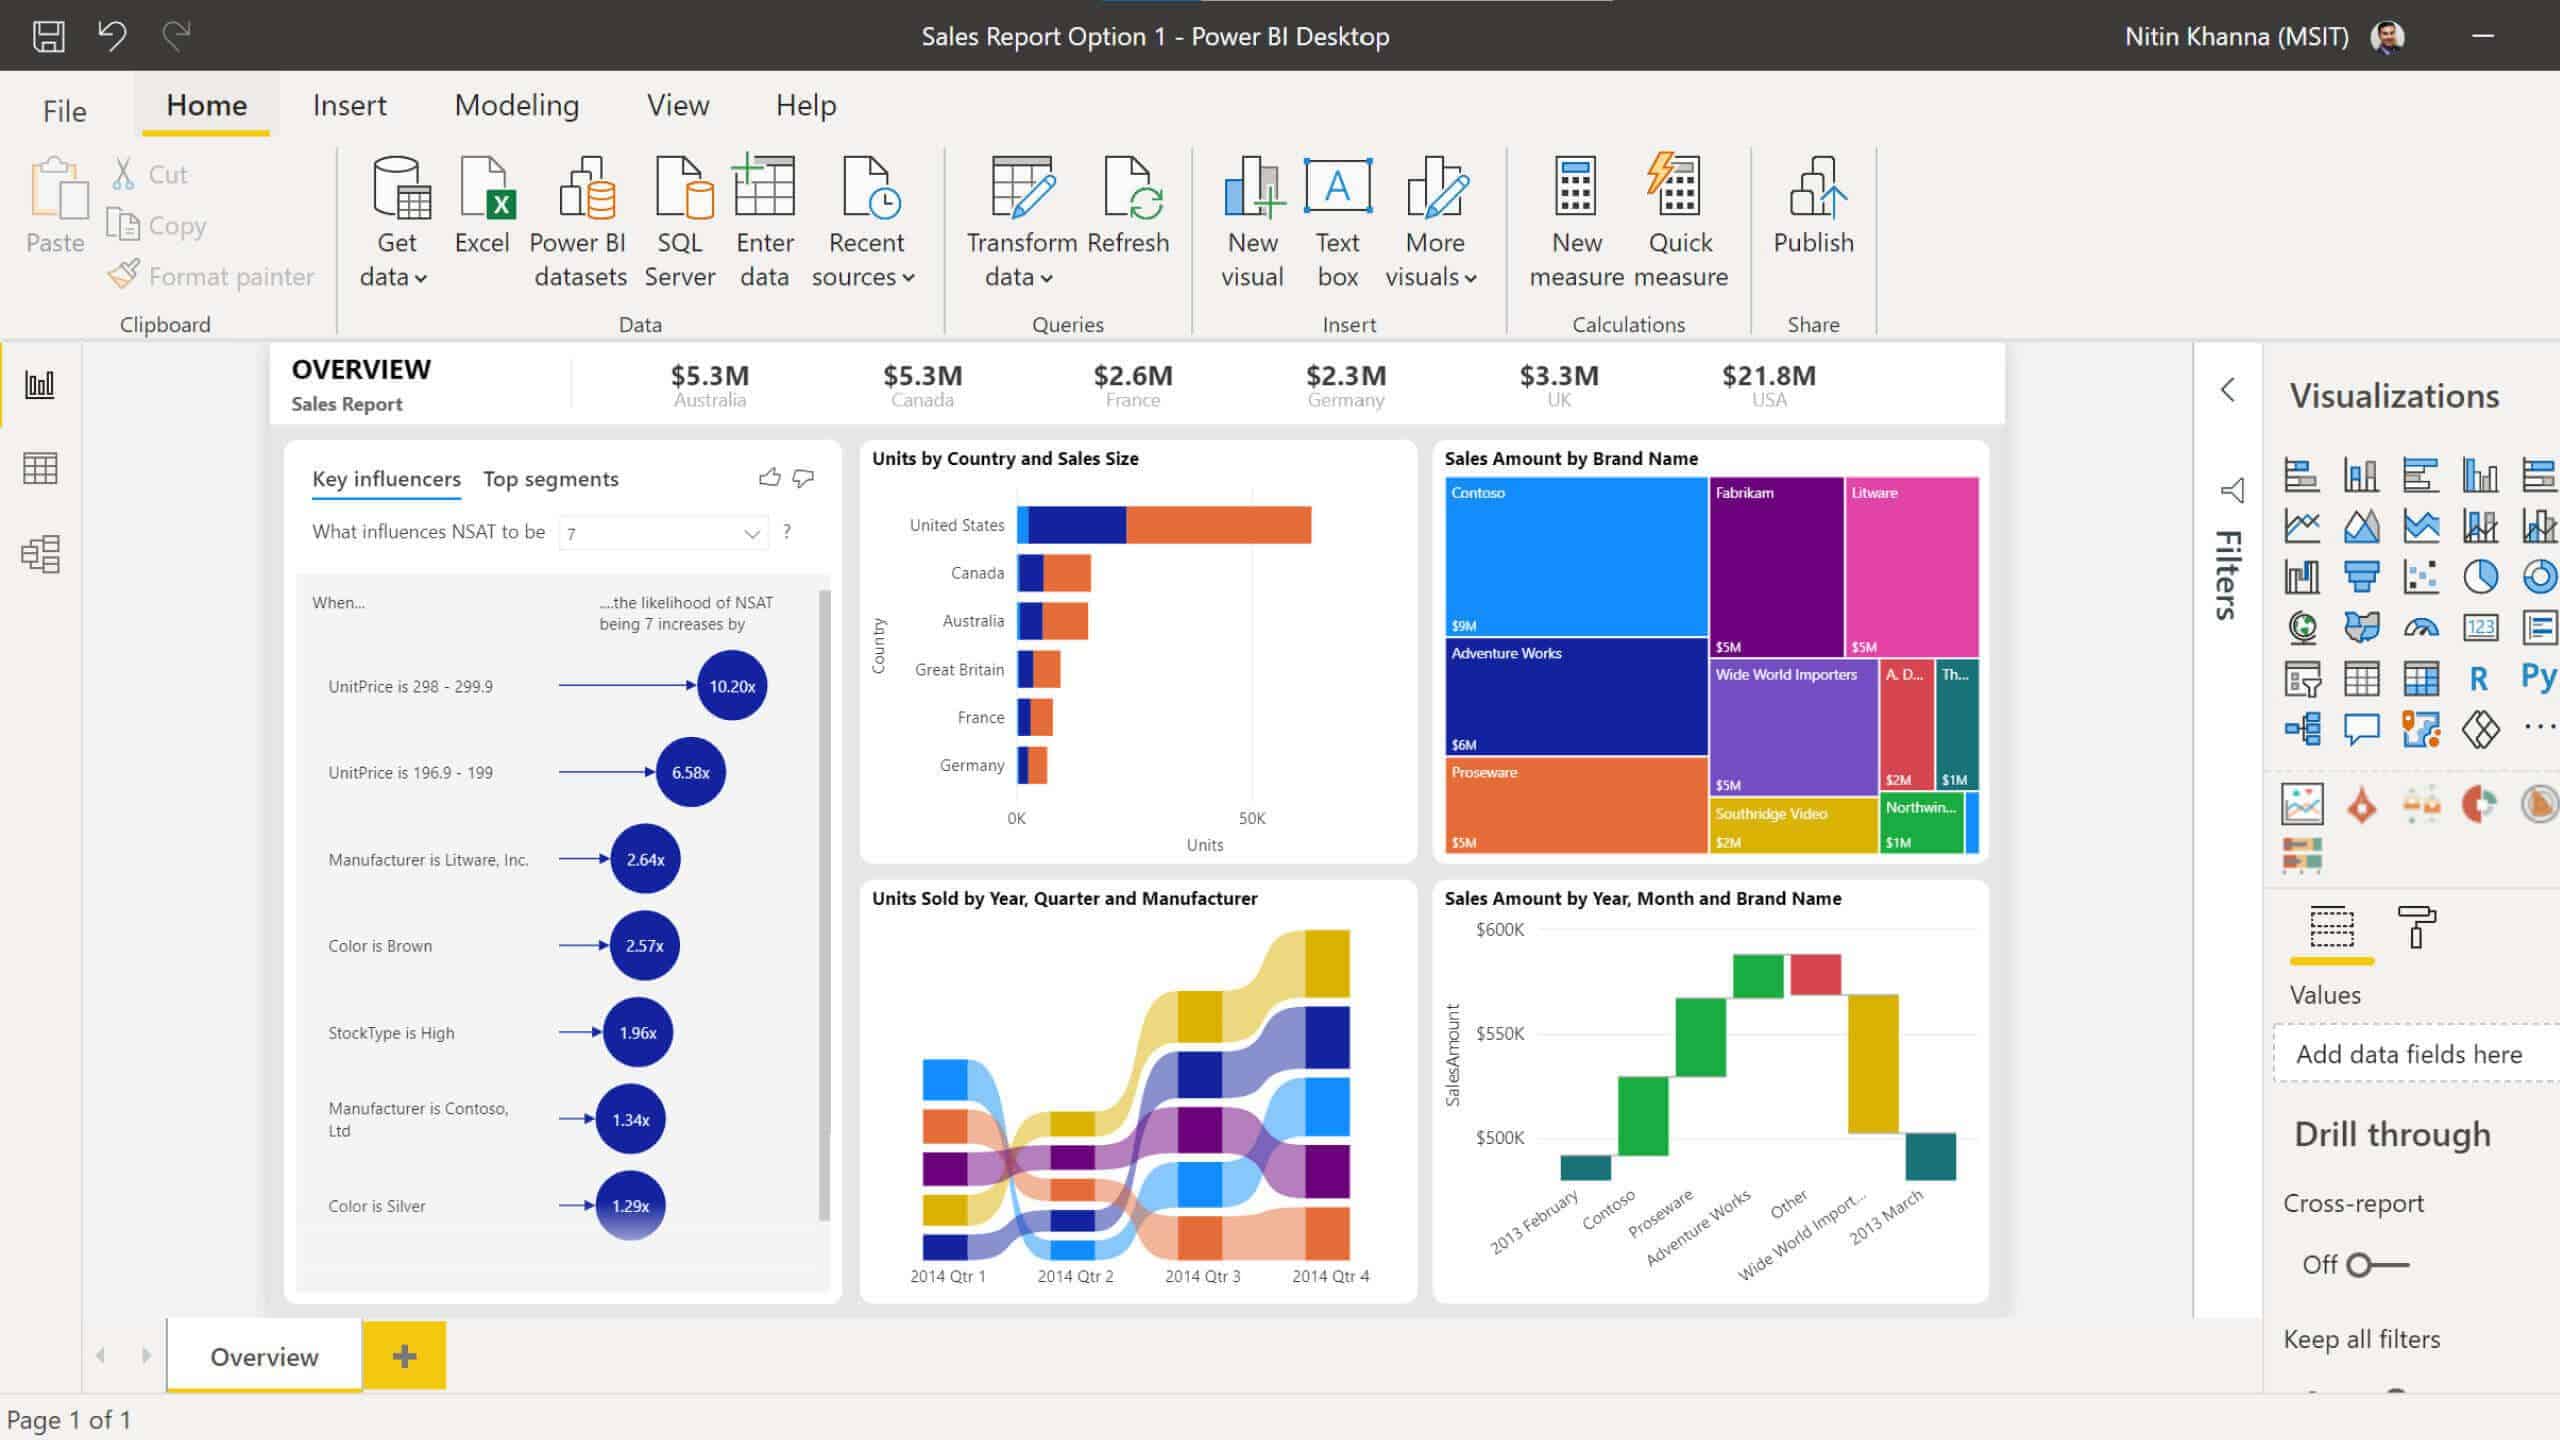
Another strong point is its connectivity. With over 130 integrated connectorsPower BI can access any data source, whether it's a web page, a CSV file, a relational database or unstructured data in the cloud. For output, Power BI offers a wide range of visuals and pre-packaged graphs that can be customised. And if this selection isn't enough, its AppSource marketplace brings together more than 300 free visuals from the community. " The downside is that there are so many visuals that it can take a long time to find the right one.

For Nicolas Dubois, Power BI is aimed at all types of reporting and therefore all levels of the company. Starting with operational staff, who need reports that enable them to monitor activity and report back to middle managers. This may relate to performance indicators such as the percentage of sales of a product in relation to overall sales, for a sales department, or monitoring the rate of absenteeism, for human resources.
Business experts will be able to analyse the data using the R or Python editor, which is directly supported by Power BI, or using the 'quick measures' feature, which provides classic statistical functions such as time variations or contextual calculations.
Strategy tool
And finally.., the tool can be used to build strategic dashboards. "At a glance, decision-makers can analyse the health of their company by bringing together performance indicators from different departments: HR, finance, management control, production, etc. in a single view. says the expert.
In 2020, with the massive use of teleworking, 64.2 zettabytes of data were created worldwide, according to Statistica's "Digital Economy Compass" report. The astronomical threshold of 2,000 zettabytes is expected to be passed by 2035, i.e. around 2,500 times the estimated number of grains of sand on the planet as a whole. This explosion in the volume of data makes it all the more urgent to make it intelligible."We need to be able to draw immediate and synthetic conclusions from this mass of data with regard to business issues, based on effective reporting models". says Nicolas Dubois. “ This involves combining different data from the web, the cloud and the personal datathen store them in a single location".

Empowering business experts
Power BI is part of the generation of self-service BI tools with Tableau and Qlik SenseThis is a major advance on traditional solutions such as IBM Cognos or SAP BusinessObjects. It enables business experts - such as management controllers, financiers or HR managers - to create their own analysis and indicators. "In the past, because they were dependent on IT, they had to wait several days, even weeks, for a report that didn't always meet their expectations.
The solution's cloud platform, called PowerBI.com, then enables the report or dashboard to be shared across an organisation. Using secure workspaces, authorised team members can collaborate and add content. The underlying datasets can be refreshed automatically. Power BI.com also offers a system of notifications and alerts. "The French Blood Establishment uses it to warn if the platelet threshold falls below a certain value". illustrates Nicolas Dubois.
Integration into the Microsoft ecosystem
The integration of Power BI with the Microsoft ecosystem is another strong point. It is possible to declare the members of a workgroup from within the Microsoft 365 collaboration suite.
Power BI also benefits from the services offered by Azure, the American publisher's public cloud offering. For example, Vinci Energie anticipates production line breakdowns by installing connected sensors. The data is collected by Power BI, all within an Azure architecture.
For Nicolas Dubois, the very dynamic Microsoft community offers a wide choice of tutorials and instructional videos for self-training on the solution. But this is no substitute for real training with a professional in the field who can adapt to your specific needs. To take things further, Microsoft's proprietary DAX (data analysis expression) language lets you write powerful formulas that can combine all kinds of statistical functions and operators to analyse data.
Finally, Microsoft has adopted an aggressive pricing policy, starting at €8.40/user/month for the Power BI Pro version, which has forced its competitors to follow suit. The desktop application, Power BI Desktop, is free, allowing users to test the tool and create their first reports. On the other hand, sharing in the cloud is not free, but the monthly price per user is particularly low for the world of business intelligence, making it accessible to all corporate structures.


