

Excel is the software most widely used by companies for processing and presenting data. However, it reaches its limits as soon as you want to manipulate large quantities of information. To overcome these technical limitations, there is a powerful solution available to everyone: Python. Senior data scientist and ORSYS trainer Audrey Quessada Vial* demonstrates by example the superiority of Python for analysing data.
Since the 2010s, data has become the new black gold for businesses. Big data, the digital transformation and the development of artificial intelligence have changed the game. How can data be used effectively?
Excel is, of course, at the top of the list. Widely used and easy to use, it remains indispensable. But as soon as you want to use massive data, beyond 1 million entries, you come up against its technical limitations. The spreadsheet gives up beyond 1 million lines (1,048,576 lines to be precise, i.e. 220).
Many datasets exceed this size. These include historical stock prices (809 MB in zip format for US stocks), the Sirene database of French companies from INSEE (1.3 GB), the national buildings database from the Centre Scientifique et Technique du Bâtiment (5.3 GB), and the database of French trademarks from INPI (15 GB).
To overcome these limitations, you need to abandon Excel and turn to Python. Why Python? Python stands out from other solutions for processing massive data (R, Julia, MATLAB, Scala, SQL, etc.) because of its simple syntax, memory management and, above all, its impressive number of libraries.
Python is aimed at data scientists as well as non-specialists such as finance and marketing professionals, and more generally at all advanced Excel users.
Python's libraries, most of which are open source, can be used to extend its capabilities in many areas. For data, the flagship library is Pandas.
Python and Pandas, your data allies
Getting to grips with Python and Pandas is relatively quick and straightforward, making them ideal for newcomers to programming. No wonder Python will be the most widely used language in the world in 2022, ahead of Java and C/C++, according to the PYPL popularity index. In fact, Python skills are highly sought after by companies: it is the second most requested language in job advertisements after JavaScript, according to a study by theUniversity of California, Berkeley.
Pandas doesn't come from the name of the friendly animal that is the symbol of China. Bangel Data, a data structure widely used in econometrics, the statistical study of economic data.
The power of Pandas comes from its speed in processing data. It can easily handle a million entries in a matter of seconds.
Flexible, it can be used for basic data visualisation and to create different views of the dataset using pivot tables. It is also possible to group data by category and perform aggregation operations ranging from the simplest (cumulative sums or averages, for example) to the most complex. What's more, with just one line of code, you can open your file and then work on the data. You can even run SQL queries with Pandas.
Pandas also accepts an impressive list of file formats: CSV, XLSX, SQL, Apache Parquet, HDF5, JSON... and many more.
To sum up, the major advantages of Pandas over Excel are :
- managing millions of lines
- speed
- task automation: with Excel, this is limited when using VBA or macros
- reporting using the Jupyter Notebook platform for data visualisation
- cross-platform compatibility: you can work on both macOS and Windows.
Switching from Excel to Python and Pandas
With a little knowledge of Python, it's easy to switch from Microsoft Excel to Pandas. Most tasks that are done in Excel can also be done in Pandas.
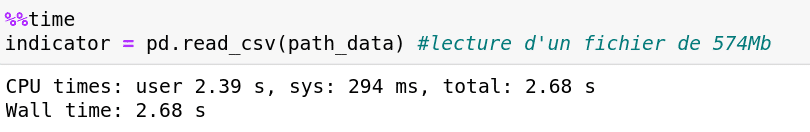
Let's take an example to illustrate the ease and power of Python and Pandas. Here is a World Bank dataset that can be found on the site Kaggle. This file is 574.3 MB in size and contains almost 6 million entries. It contains a number of economic and social indicators by country and by year.
It takes less than 3 seconds to read this file with a single line of code.
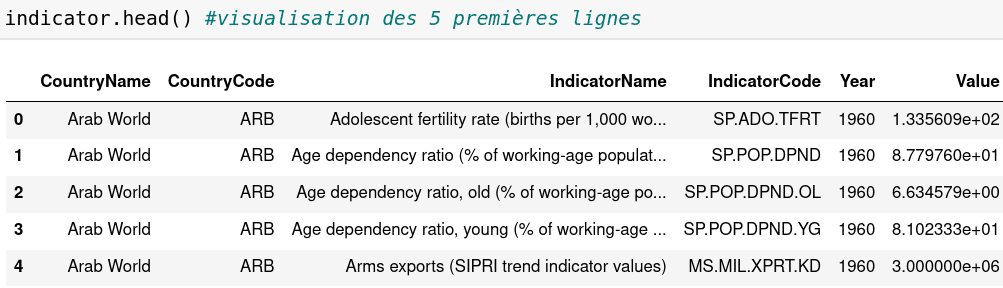
We're now going to look at the first five lines to see what this data corresponds to. Once again, a single line of code is all that is needed:
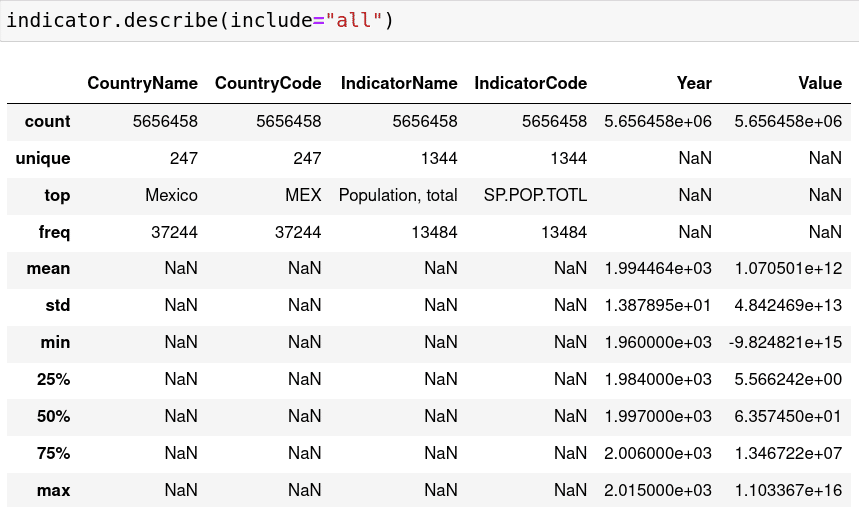
It is also possible to retrieve the main statistical indicators associated with each column:
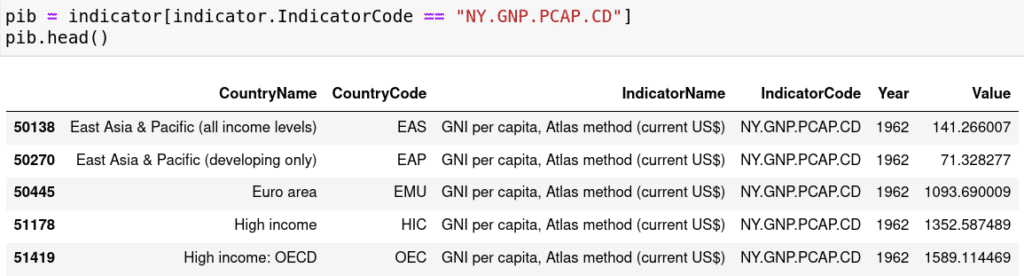
Filtering the data couldn't be simpler. In the following example, we will filter the data to keep only GDP per capita as an indicator:
What if we calculated the average and maximum GDP per capita over all the years for each country? Once again, only one line of code with Pandas is needed:
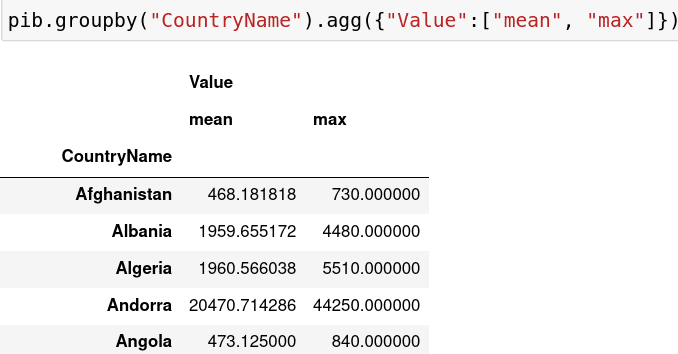
These few examples illustrate the full power of Pandas. They are far from exhaustive of the possibilities available to you.
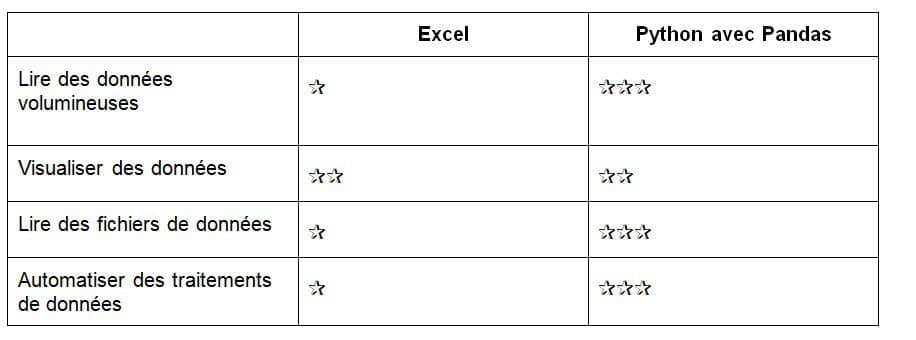
We can summarise in a table the uses for which Python and Pandas can be used instead of Excel.
Pandas is an extremely powerful library for working with data. It has many advantages over Excel and allows you to go much further in processing data and automating tasks. Its flexibility and speed make it an indispensable tool for data science.
However, Pandas is not the only Python library to offer advantages for processing data. Visualisation tools can be used to understand the interactions between parameters. Many libraries offer visualisation tools: geovisualisation with Folium, interactive visualisation with Plotly, creation of interactive dashboards with Dash, visualisation of voluminous data with Holoviews - there's no shortage of choice.
In conclusion, Python has a lot going for it. Thanks to its freely accessible libraries, it outperforms Excel when it comes to processing and visualising massive data (structured or unstructured). Our training courses will help you quickly get to grips with this powerful tool.
